Instructions

Layer Creation

To add your layer data into your central storage, so that it can be retrieved and used throughout the rest of the app, navigate to the top left header button (click to expand).

Select the Menu Item labelled Data Engine, this will open the Data Engine UI

The Data Engine UI is broken down into three parts; the top left contains three buttons signifying available data, data yet to be published and a button to begin the import process. The Main UI window contains a list of Layers available (or awaiting publishing). The Left hand filter list allows users to filter and search the available layers.

The Data Engine UI

To Import a spatial file, click the + Icon, the third button of the top left button bar.

You will then be presented with the importer window. At the time of writing the application will support Shapefiles (zipped) and GeoJson, as well as raster data. For ease of processing it is preferable to upload raster data either in a GeoTiff format, or as ASCII Grid file (zipped, along with a World File)

  • Layer Name: A short descriptive name for the layer
  • Layer Type: List of available Layer Types (Hazard, Exposure, Bounary or Risk)
  • Description: An optional desciption of the spatial data
  • Security Level: The level of access for the Data - options are Confidential or Open Data
  • Data Quality: Low, Medium or High
  • Collected By: List of user defined Organisations who collected the data
  • Data Collected On: Date when spatial data was collected
  • Tags: Comma Seperated list of tags to allow easier searching
  • File: The Spatial File to be uploaded

After filling out the importer window and selected the relavent file, you should be taken back to the Data Engine UI where the new layer will be available. Depending on the size of the file, it may take some time to process before being available (ranging from a few seconds to a up to a minute).

Layer Editing

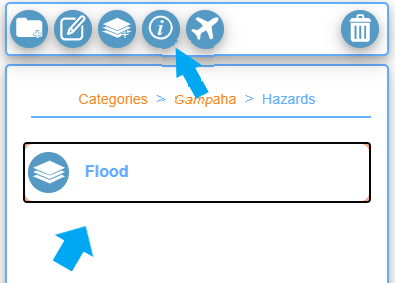
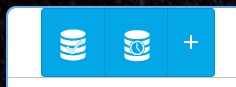
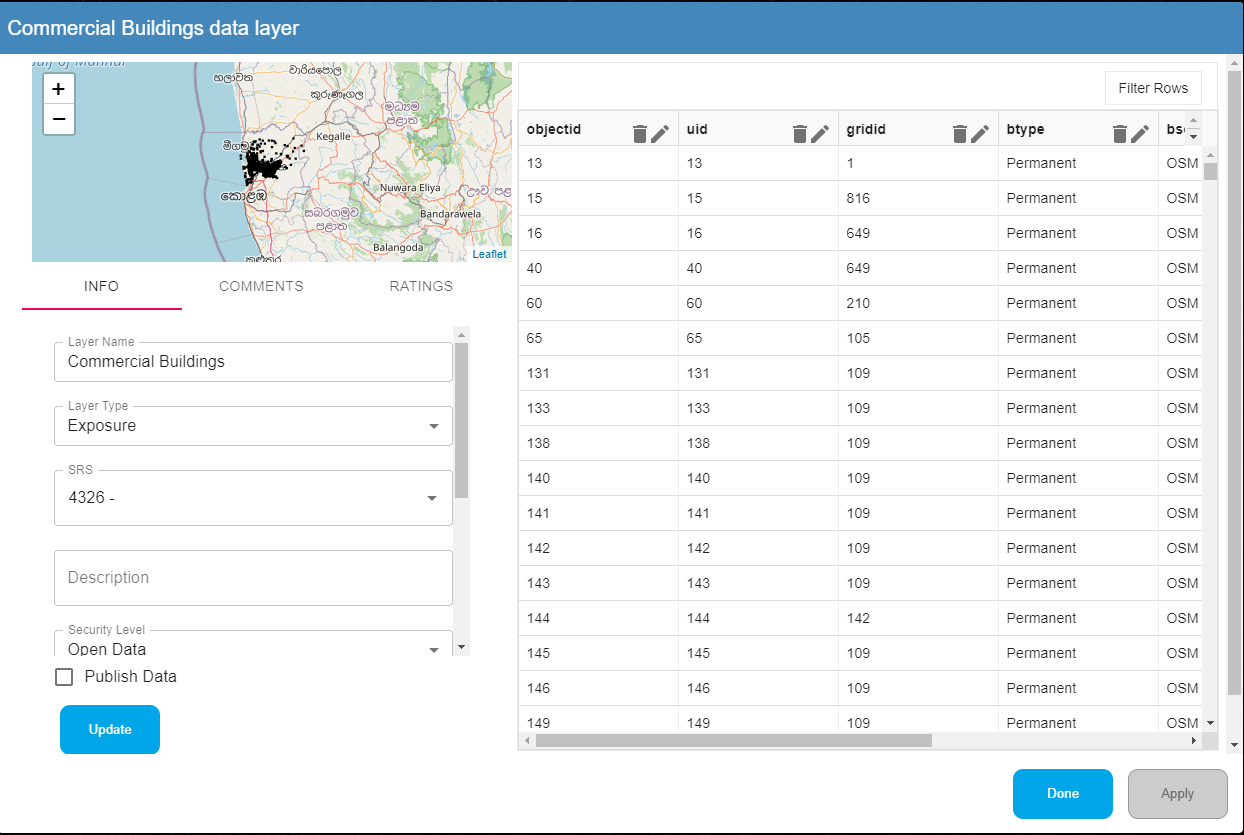
After importing a new layer it will be available in the "Data in Preparation" list. This can be shown via the middle button (With a clock symbol on it) in the top left button bar. Clicking on the unpublished layer will bring the Layer Editing and Preview UI. This is composed of a preview map (top left), a data grid showing the underlying spatial data, and a meta data view (left).

Editing Meta Data

The Meta data editing UI functions almost exactly the same as the importer UI, with the addition of the spatial reference system for the Spatial Data (this identified during the upload process automatically. If the SRS code is zero, then this means that a reference system was not able to be identified, if order to publish the layer (and for it to be used elswhere in the app) you must provide a reference system that the layer uses. To improve performance it is advised that data is either uploaded in the Global Reference system, WGS 84 (SRS code 4326), or reprojected to this once it is in the data engine. Reprojecting a layer is a simple as selecting the required code from the drop down list and clicking update

Editing Spatial Data

The grid view gives provides a view of the underlying data as provided in the spatial file that was imported. Often these files contain unreadable or not particulary insightful fields. You can therefore edit the "view" of the data which is made available once a layer is published. You can:

  • Filter based on one or more fields
  • Delete unneccesary Columns
  • Rename Columns to use more meaningful names

Deleting a Column

To Delete a column, select the trash bin icon on the column you wish to move

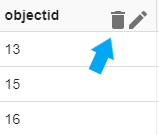
Editing a Columns Name

To Edit a columns name, select the pencil icon the column you wish to edit

Adding a Filter

To add a filter, select the filter rows button. This will enable the filter option on each column

Once you are happy with your data, click apply to update

Publishing Data

While data is unpublished, only you can view it. In order to make it available for other users to use, you will need to publish it. Once you've updated the meta data and editing the underlying data columns to your liking, publishing is as simple as checking the publish check box and clicking update.

Copying and Deleting

Copy Layer

It is also possible to duplicate an existing layer in case you wish to create different views of the same data (i.e different filters). To copy a layer simply go to the Data Available tab and hit the "copy" icon on the layer you wish to duplicate.

Provide a name and select confirm

The new layer should appear in the "Data in Preparation" tab. You can now edit this as normal and publish.

Deleting A Layer

Deleting a layer is simply a case of clicking the trashbin icon on the layer you wish to delete. Note this does not affect any duplicate layers.

Categorising and Visualising

Creating a Category

In order to visualise data on the 3D Globe, you'll need to categorise it first. This works in a similar manner to the folder structure on your computer. Think of categories as folders and layers as files. A category can contain a mix of other categories and layers. To create a category open the Category Explorer window (center left button)

Click the Folder icon on the Category Explorer Tool Bar.

Provide a name, and select the Icon button to change the Folder Icon and Colour.

Provide a name, and select the Icon button to change the Folder Icon and Colour.

Select an Icon and optionally change the category colour.

Adding a Layer for Visualistion

Once you've create a top level category, double click it to "open" it. You can now either add another sub category (following the same process as creating a category) or add a layer. To add a Layer, select to Layer Icon.

This will bring up the Data Engine UI. Select the layer you wish to add via the check box and click done.

The Layer will now appear in the folder UI. You can double click it to load it onto the map. To fly to the layers location, click the Airplane icon.

To the right hand side you can toggle the Legend On/off.

The Layer can be toggle on/off by simply click on its legend item. To remove entirely, drag the legend item to the left and then drop.

Styling

Simple Styling

To open the style editor, click the pen and paper icon on the category explorer window.

Click New Style to open up the Style Creation Window.

Provide a Style Name and then select from one of the available shape types (Point, Polygon, Line)

Select the colour and border width and click save.

Complex Styling

In addition to just styling a shape with a colour, you can create more complex styles using data from an available layer. Open the Style Editor UI, and click new style. When you are on the style creation window, click the filter drop down box and select "Filtered - Layer Data".

Click "Select" which will open the Data Engine window, check the layer you wish to use and click done. You'll now be given the option to select a field to filter on. Select the required field.

Once you've selected the field, you can then generate the style by clicking "Generate Style"

If Use Colour Ramp is not selected, this will generate random colours for each value.

If Use Colour Ramp is selected, this will generate a gradiant between the first and last colour selected.

Applying A Style

Once you've created a style, you can set it as a default style for a layer, so that it can be visualised using that style. To do so, navigate to the layer in the category explorer UI and select it, then click the Information Icon in the category explorer tool bar.

On the Layer Info UI, select the style drop down box and select the style you wish to apply, then click "Set Default". Now whenever you display the layer on the map, it will use this style.